 Download the material in pdf format by clicking on the image.
What happened in the last month?
In focus: high interest rates, strong economy
The first half of the month was still dominated by uncertainty in the energy markets triggered by the conflict in Iran and the resulting inflation fears; however, by the end of the month, diplomatic rapprochement and the gradual normalization of traffic through the Strait of Hormuz had significantly reduced the likelihood of the worst-case scenarios. The global economy was able to adapt to an extremely uncertain geopolitical environment. Investors were no longer pricing in a recession, but rather the expectation that global economic growth would be slower yet remain positive. Inflation rose again due to energy prices, but central banks increasingly viewed it as a temporary shock, while labor markets continued to prove surprisingly stable. The global economy continues to be driven by technology investments. June offered two key lessons. Instead of focusing on short-term market noise, one must concentrate on fundamentals: geopolitical news caused significant exchange rate fluctuations, but investors who disciplinedly stuck to their diversified portfolios fared well. Moreover, within a few weeks, the markets began to price in an entirely new macroeconomic scenario. For an active asset manager, this presented an opportunity to adapt quickly to the changing environment, while long-term investment goals remained unchanged.

Equity market news
Investors have once again begun to focus on corporate earnings rather than geopolitical news. Technology remained the engine of growth, and the initial public offering (IPO) of SpaceX, the market leader in the space industry, led by Elon Musk, was met with enormous interest. At the same time, the first serious debates over valuations emerged: technology stocks, which had often been overpriced, suffered a significant correction, which proved to be a healthy profit-taking move. At the same time, earnings expectations for U.S. companies continued to improve overall (in Europe, defense, industrial, and infrastructure companies outperformed). The market recognized that the global economy had not entered a recession but had shifted to a slower yet stable growth trajectory. Investors are once again willing to pay higher valuations for companies offering structural growth. The role of active stock selection is becoming increasingly important: long-term value creation continues to depend on selecting companies with fundamentally strong, sustainable earnings growth.
Bond market news
Investors have realized that an energy price shock does not automatically lead to sustained inflation and aggressive interest rate hikes, which has resulted in falling interest rates. The U.S. Federal Reserve left interest rates unchanged (3.50–3.75%), but new Chairman Kevin Warsh indicated that the fight against inflation is not yet over. Although the European Central Bank raised interest rates by 25 basis points, there was no panic-driven sell-off in bonds. Long-term government bonds have once again become an attractive alternative for institutional investors: yields on 10-year U.S. Treasury bonds fell to 4.5%, while those on comparable German bonds dropped below 3%. Investors are once again focusing on real yields, rather than merely on inflation fears. This could create a favorable environment for high-quality bond investments in the longer term. Bonds can once again serve as important stabilizing components of a well-balanced portfolio.
Alternative investments news
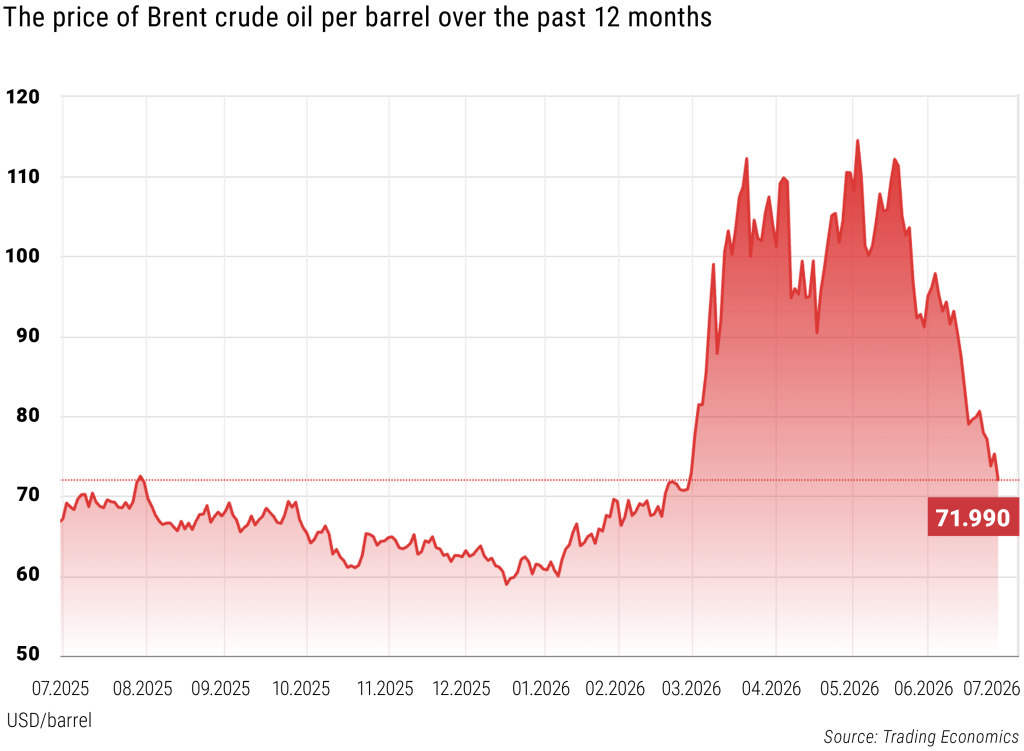
The most significant event of the month was the rapid correction in oil prices. The market had previously priced in a prolonged supply shock, but diplomatic tensions eased, significantly alleviating these fears. As a result, the price of Brent crude fell by about 20%. The natural gas market also calmed down, which improved the inflation outlook. While gold remained an important safe-haven asset, it lost some of its short-term momentum. The performance of industrial metals continued to be supported by AI data centers, electrical infrastructure, and defense investments. Demand for copper remained structurally strong, investors increasingly distinguished between cyclical and structural commodities. Geopolitical shocks may be temporary, while structural demand trends, digitalization, the energy transition, and infrastructure, could persist for many years.
What can we expect in the coming period?
Investment clock
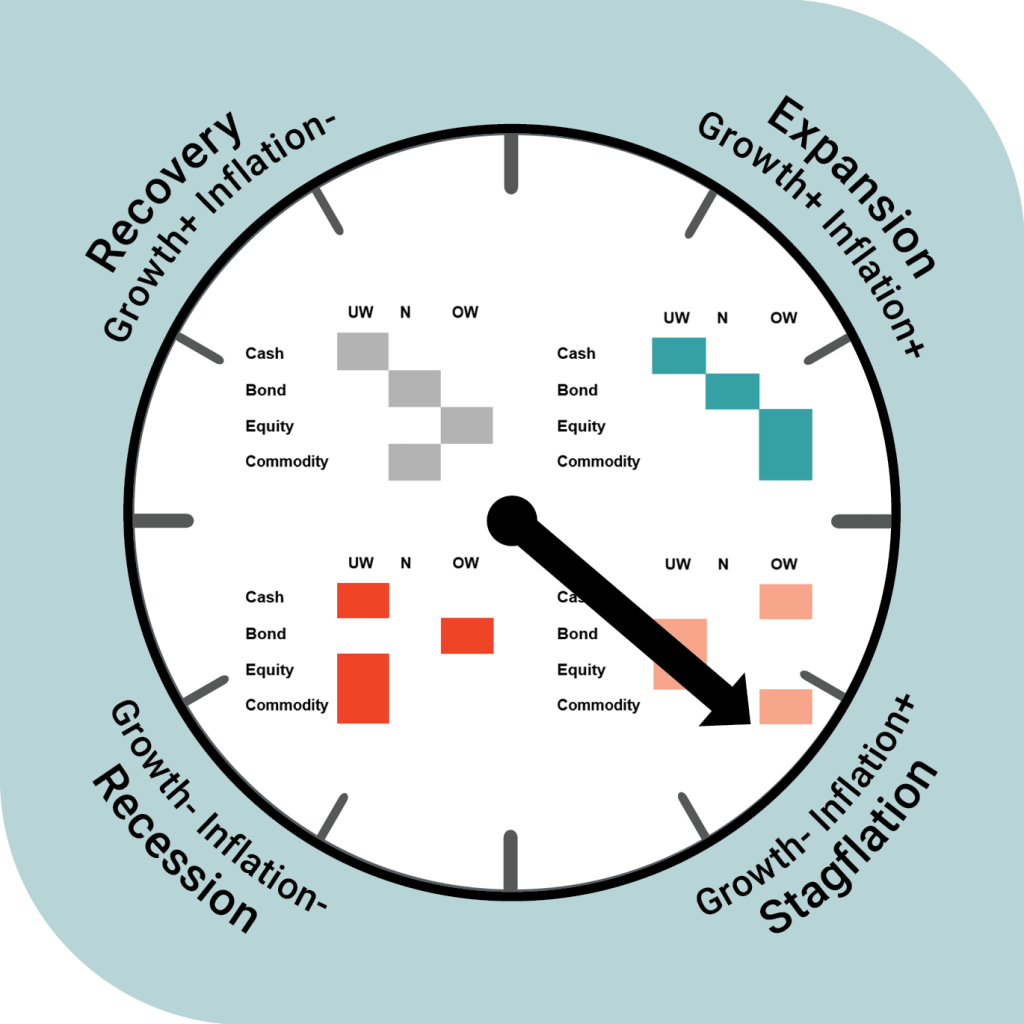
The VIG Global Investment Clock, a scientifically based tool that uses indicators to forecast economic cycles, is predicting stagflation (weak growth coupled with high inflation).
Positive news regarding the reopening of the Strait of Hormuz has had a beneficial effect on the macroeconomy. The global price of oil has fallen rapidly and significantly, and peace talks between the United States and Iran are moving in the right direction, all of which has brought a sense of relief and, with it, improved consumer confidence, and may help temper inflation expectations. This is exactly what is needed: the global economy remains weak, but a lasting peace would help reduce global uncertainties.
The U.S. economy is currently on a “no landing” trajectory. The labor market is strong, and inflation jumped to 4.2% in May. Fed Chair Kevin Warsh’s debut in June took a “hawkish” that is, tightening (suggesting higher interest rates) turn, which led to a stronger dollar and expectations of interest rate hikes. In the eurozone, interest rates were raised as early as June due to surging inflation, but despite Germany’s infrastructure package, no turnaround in growth is expected, so the stagflationary environment persists.
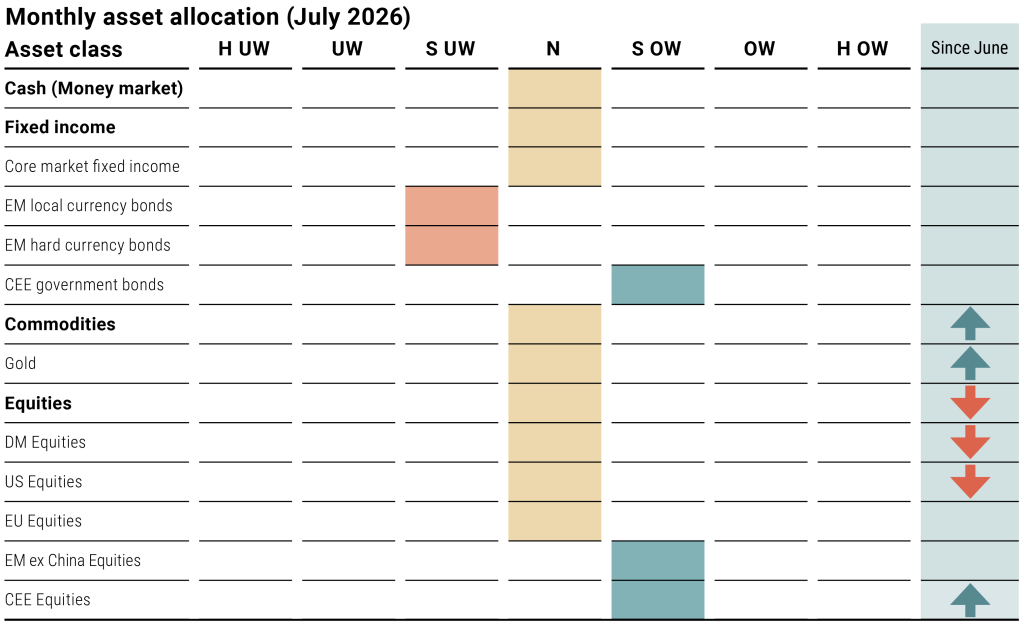
Tactical Asset Allocation
We have reduced the weighting of equities
The possibility of continued dollar strength could be a cause for concern regarding stock prices, as it would result in a decline in liquidity in global capital markets and could trigger a significant wave of profit-taking in “overbought” assets, that is, those with excessively high valuations. And not just those: such a shift in investor sentiment could drag down riskier assets in general, notably the stock markets. But the greatest danger would be to those stocks that have risen the most in recent months, primarily shares of companies linked in one way or another to the technology and artificial intelligence sectors.
Commodities May Gain Momentum
We are seeing more momentum in the commodity markets than in previous months; we expect gold, in particular, to strengthen. The precious metal had previously proven to be one of the most profitable investments (its price had risen to record levels due to military conflict), but the sudden easing of geopolitical tensions triggered a rapid price drop of about 20%. Yet demand remains strong, not from speculators seeking short-term gains, but from central banks diversifying their reserves for the long term. Their purchases could provide support for the price, which may begin to rise again, thereby allowing gold to once again fulfill its role as a balancing asset within the portfolio.
Source: VIG Asset Management
The weights indicate the evaluation of the respective country, region, and asset class, providing a basis for portfolio managers in structuring portfolios and establishing positions, thus helping to capitalize on market opportunities.
Weights:
- Strongly underweight
- Underweight
- Slightly underweight
- Neutral
- Slightly overweight
- Overweight
- Strongly overweight
Changes – change compare to the the previous month
The table was prepared based on our investment clock and quadrant modell**.
Focus fund: VIG European Equity Fund
The positive outlook evident in regional stock markets puts the VIG Central European Equity Fund in a strong position. The Fund’s objective is to invest in the stock markets of the Central and Eastern European region, and it is recommended for investors who wish to participate in the long-term performance of companies listed on regional stock exchanges. Huge amounts of capital are flowing into the region’s stock markets, partly because the end of the U.S.-Iran-Israel war is now within reach: the improving outlook is emboldening investors worldwide, who are thus more willing to venture into emerging markets that are slightly riskier but promise higher returns. Within this context, Hungary and Poland are the “favorites”: analysts are consistently revising upward the earnings forecasts for listed companies in both countries, while stock prices remain low relative to profits, both regionally and internationally. The financial sector, in particular, is performing well, it’s no wonder that foreign capital is flowing in.
Based on our expectations (based on tactical asset allocation), the fund of the month may outperform in the near future.
VIG Central European Equity Fund

ESG theme of the month: the tournament of records: can the biggest FIFA World Cup ever also be sustainable?
The 2026 FIFA World Cup has already set records in many respects. It is the first tournament to feature 48 national teams, the World Cup with the highest number of matches in history – 104 in total – and it will be hosted across 16 stadiums in three countries: the United States, Canada and Mexico. But can sustainability remain a priority when organizing an event of such unprecedented scale? Is this FIFA’s greatest sustainability challenge to date?
Environmental challenges of the FIFA World Cup
As one of the world’s most popular sports, football captures the attention of billions of people every four years during the FIFA World Cup.
Attendance records have already been broken. The previous record of 3,587,538 spectators, set in 1994, was surpassed by June 28, when 4,644,549 fans had already attended the first 72 group-stage matches across the United States, Canada and Mexico. However, this enormous success comes with a significant environmental cost. Supporters and national teams travel vast distances between host cities, generating millions of tonnes of CO₂ emissions. Even the travel undertaken by FIFA president between matches contributes to the tournament’s environmental footprint.
In addition, stadium operations and event management require enormous amounts of energy. Large-scale waste generation, food waste, and the substantial water and energy consumption associated with fan zones and accommodation facilities further increase the environmental burden.
Despite what appears to be a challenging environmental balance sheet, the tournament’s organizers have not remained passive. On the contrary, they have introduced a range of initiatives designed to mitigate these impacts.
FIFA’s sustainability strategy
For the 2026 FIFA World Cup, FIFA has developed a dedicated Sustainability & Human Rights Strategy, providing a comprehensive framework for addressing the tournament’s social, environmental and economic responsibilities.
The strategy is built around four key pillars:
- Social
- Environmental
- Economic
- Governance
Within this framework, FIFA has committed to implementing consistent environmental and human rights audits across every host city and stadium. While these commitments sound promising on paper, implementation is equally important.
In practice, FIFA aims to reduce the tournament’s unavoidable environmental footprint by engaging local communities, respecting labour rights, and monitoring and reducing greenhouse gas emissions throughout the event.
Stadiums designed with sustainability in mind
Most of the stadiums hosting FIFA World Cup matches have undergone significant infrastructure upgrades to meet modern sustainability standards.
Thirteen of the sixteen venues have received recognised green building certifications, demonstrating that existing infrastructure can successfully be adapted to meet higher environmental standards. This is particularly important because the 2026 tournament relies primarily on existing stadiums – many of them NFL venues – rather than constructing entirely new facilities.
Atlanta’s Mercedes-Benz Stadium, which will host eight World Cup matches, provides one of the strongest examples of sustainable stadium design. More than 4,000 solar panels generate approximately 1.6 million kilowatt-hours of renewable electricity annually, reducing the stadium’s electricity consumption by around 29%.
The venue has also invested heavily in water conservation. A four-million-litre underground cistern collects rainwater for cooling systems and irrigation, reducing pressure on the municipal water supply while providing a sustainable water source for maintaining both the playing surface and the surrounding landscape.
Meanwhile, in Texas, the Houston Host Committee has committed to supplying all major official tournament venues with electricity generated entirely from renewable energy sources.
Japanese fans set the gold standard
While FIFA and the host venues deserve recognition for their sustainability efforts, individual responsibility can be just as important in reducing the tournament’s environmental footprint.
Japanese supporters have become the benchmark for environmentally responsible fan behaviour. During the 2022 FIFA World Cup in Qatar, they earned worldwide admiration by systematically cleaning their seating sections after every match, equipped with their now-famous blue rubbish bags.
Their exemplary conduct has inspired others to follow suit. After the Japan–Netherlands match at AT&T Stadium in Dallas, New York Giants quarterback Jameis Winston picked up a rubbish bag himself and joined Japanese supporters in cleaning the stands.
This powerful act of solidarity demonstrates how positive fan culture can spread across borders and encourage collective environmental responsibility.
The World Cup’s power to unite people
From an ESG perspective, the Social (S) pillar is just as important as the environmental dimension.
Held every four years, the FIFA World Cup brings together millions of people through a shared passion for football. Fans from every generation and every social background come together to support their national teams, creating a unique atmosphere that extends far beyond the matches themselves.
Boston, for example, came alive thanks to Scottish supporters, with its streets transformed into a vibrant multicultural festival for several days. Meanwhile, fans from the Netherlands, Portugal and Norway have also made headlines with their distinctive chants and celebrations, creating unforgettable moments that have become part of World Cup folklore.
These scenes demonstrate football’s remarkable ability to bridge cultural and political divides. At a time when geopolitical tensions often dominate international relations, the World Cup offers a rare opportunity for people around the world to experience a genuine sense of global unity.
Source:
https://inside.fifa.com/organisation/news/records-world-cup-2026-group-stage-sets-new-benchmark
https://www.bbc.com/sport/football/articles/cgev5wy0zg3o
https://inside.fifa.com/tournament-organisation/world-cup-2026-sustainability-strategy/introduction
https://sustainabilitymag.com/news/world-cup-2026-the-energy-use-of-fifas-largest-tournament
https://sustainabilitymag.com/news/world-cup-2026-the-energy-use-of-fifas-largest-tournament
This is a distribution announcement. Detailed information is needed to make a well-founded investment decision. Please inform yourself thoroughly regarding the Fund’s investment policy, potential investment risks and distribution in the Fund’s key investment information, official prospectus and management regulations available at the Fund’s distribution outlets and on the Asset Management’s website (www.vigam.hu). The costs related to the distribution of the fund (buying, holding, selling) can be found in the fund’s management regulations and at the distribution outlets. Past returns do not predict future performance. Please note that in comparison with other investment funds, the return achieved may be affected by differences in the reference index and therefore the investment policy.
The future performance that can be achieved by investing may be subject to tax, and the tax and duty information relating to specific financial instruments and transactions can only be accurately assessed on the basis of the individual circumstances of each investor and may change in the future. It is the responsibility of the investor to inform himself about the tax liability and to make the decision within the limits of the law.
The information contained in this leaflet is for informational purposes only and does not constitute an investment recommendation, an offer or investment advice. VIG Asset Management Hungary Closed Company Limited by Shares accepts no liability for any investment decision made on the basis of this information and its consequences.
The Asset Management’s license number for managing alternative investment funds (AIFM) is: H-EN-III-6/2015. The Fund Manager’s license number for UCITS fund management (collective portfolio management) is: H-EN-III-101/2016.